WebsiteHunt is broughtBrought to you by Redact Everything
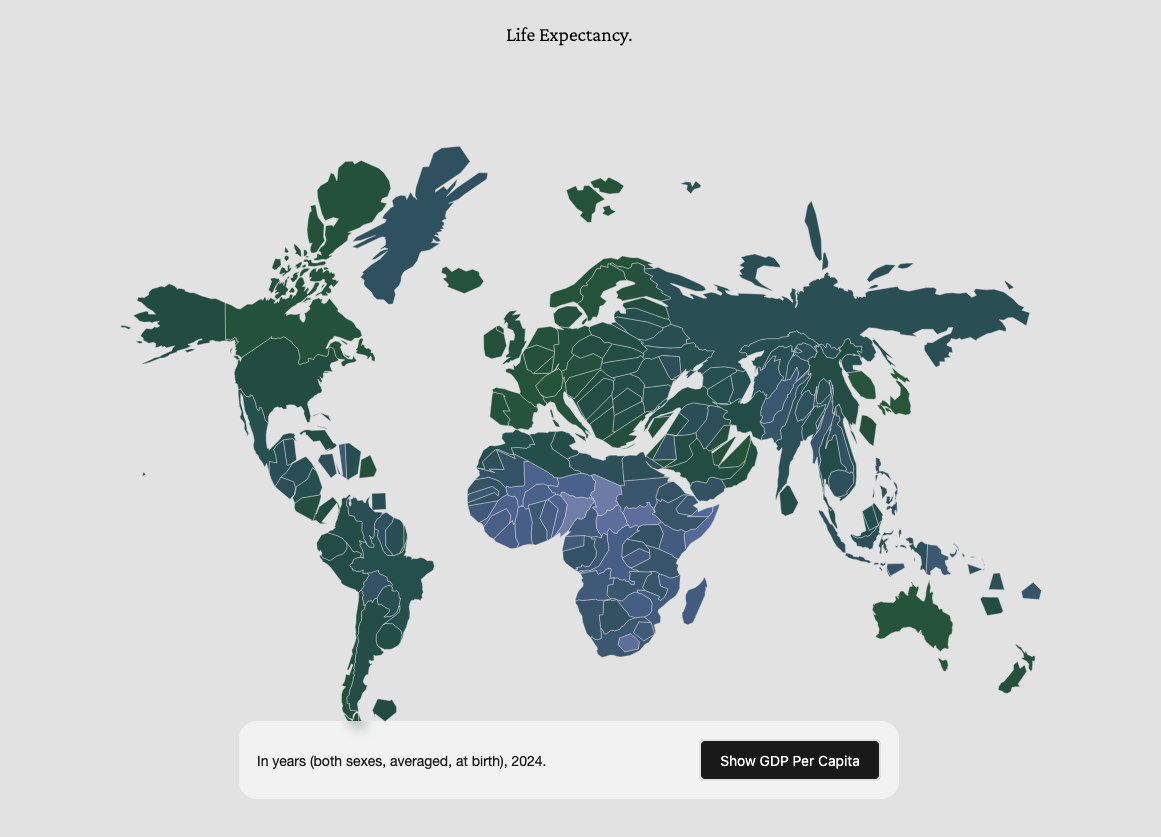
Neighbors in Numbers
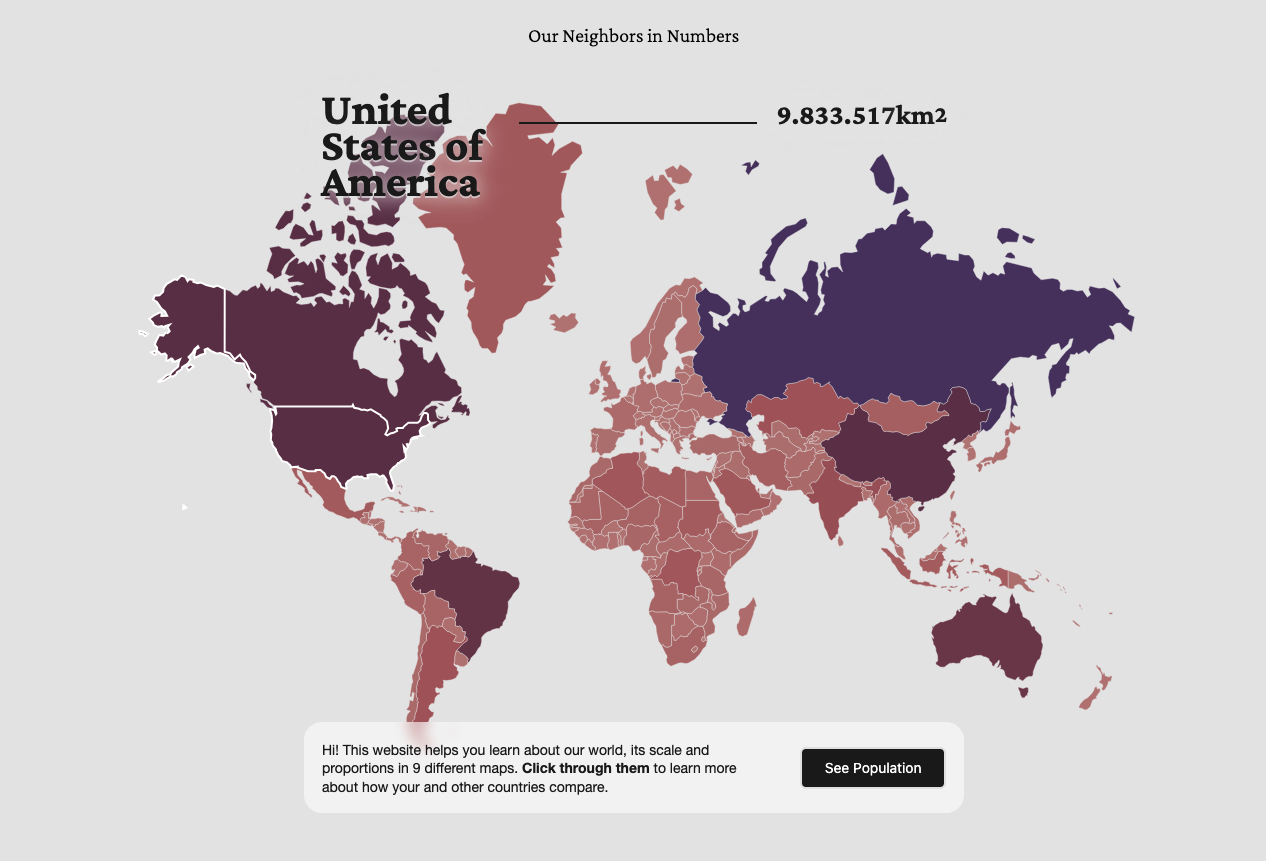
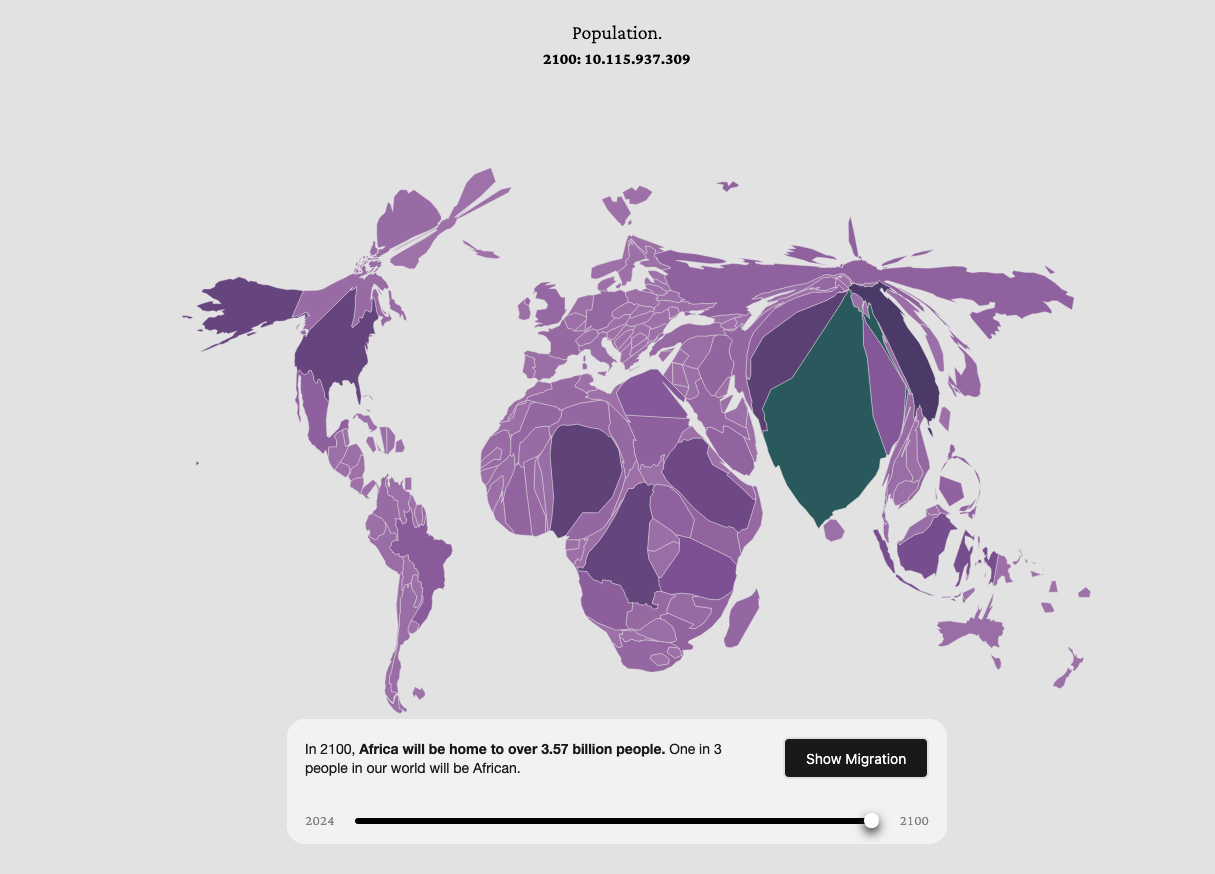
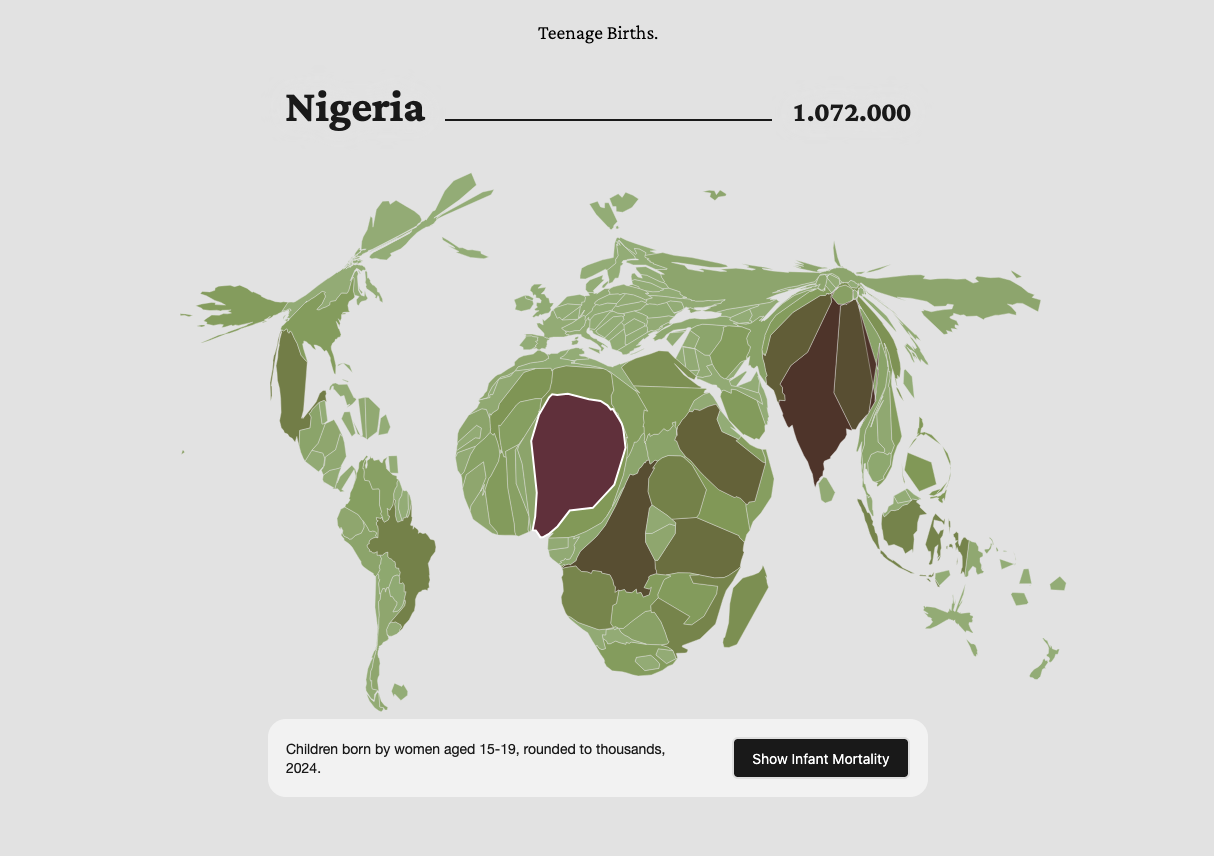
9 cartograms to better understand our world.
This site presents cartograms that visualize various global data, including GDP and CO2 emissions, using D3 and topogram. It aims to provide a clearer understanding of land sizes and population statistics through innovative mapping techniques.
Comments
Loading comments...
You might also like

HiAPI
One API for leading AI image, video, and text generation models. ✨ Premium
Mistral OCR
Introducing the world’s best document understanding API.
Psychology of Human Misjudgment
Understanding why we behave the way we do
MT
My Tax Receipt
Understand where your federal tax money goes.
Word-Unscrambler-co
Unscramble the words with our free Word Unscrambler to find the h
TG
Telemetry - GitHub CLI
Understand what GitHub CLI telemetry sends and opt out.
Bizarre Bookshelf
The weirder, the better
SuperX
Grow faster on 𝕏 with hidden insights. Understand your audience,
Mac Mouse Fix
A simple way to make your mouse better.
codeonthecob.com
A better way to practice coding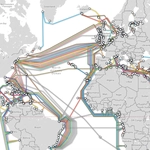
Submarine Cable Map
Shows all underwater cables and who owns them
Paper Planes
Throw & catch paper planes around the world (on your phone)
DP
Dithering - Part 1
Understanding how dithering works, visually.
User Persona Generator
Understand your audience without running 50 interviews
ST
Stacking
A better workflow to manage pull requests
Works Database
Build better campaigns by connecting with top journalists and cre
BU
Bulletpapers
Understand complex papers in seconds
Symphony
Write programs you can talk to
KushoAI
AI agent to understand, write & execute tests for APIs in minutes
ED
edX
Take great online courses from the world's best universities