Series Ratings Chart
Graph Your Favourite TV Shows!
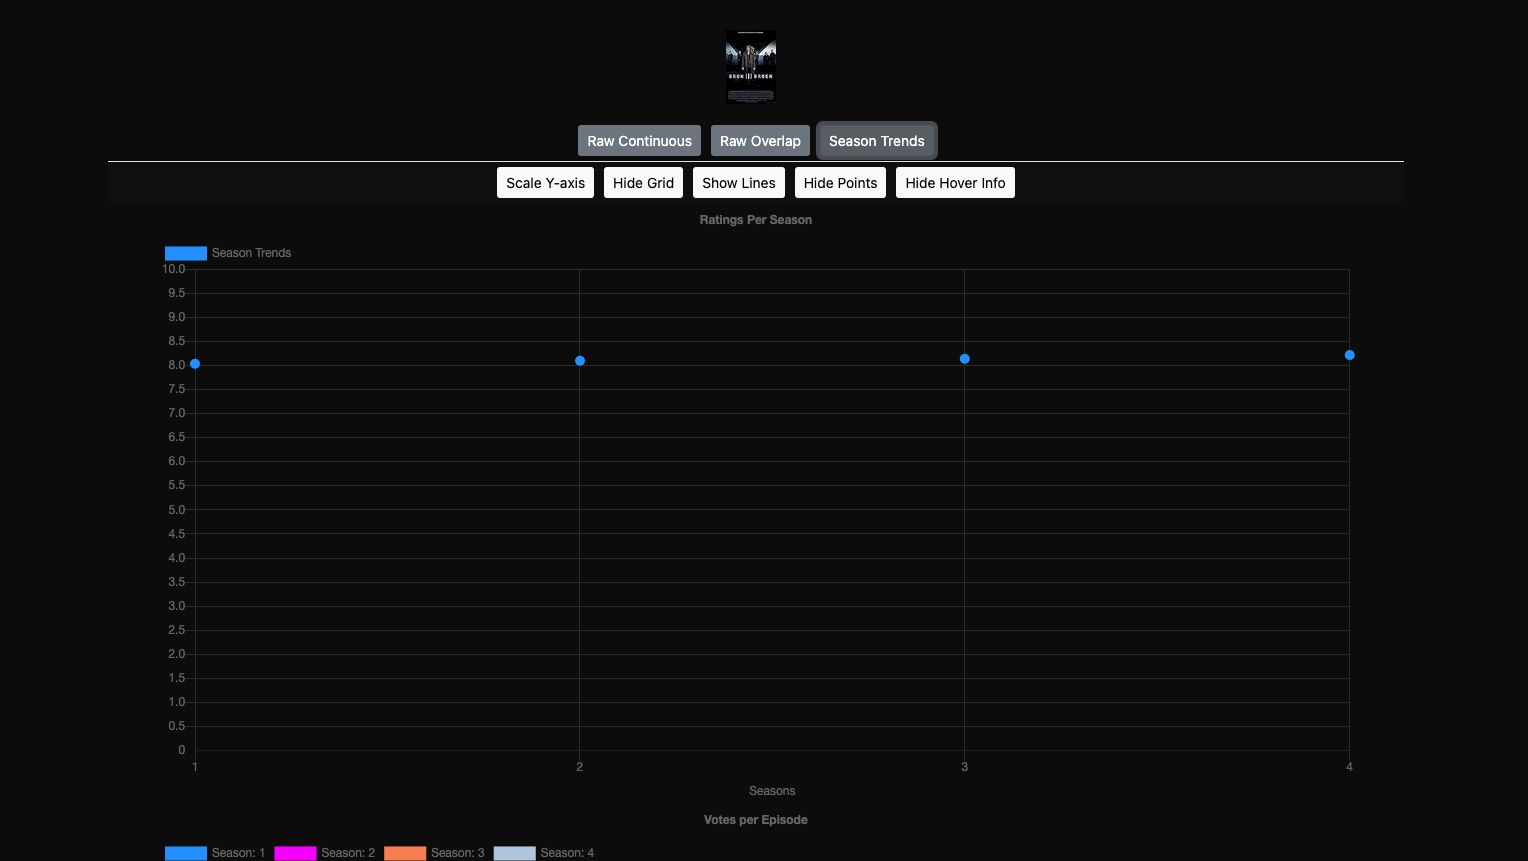
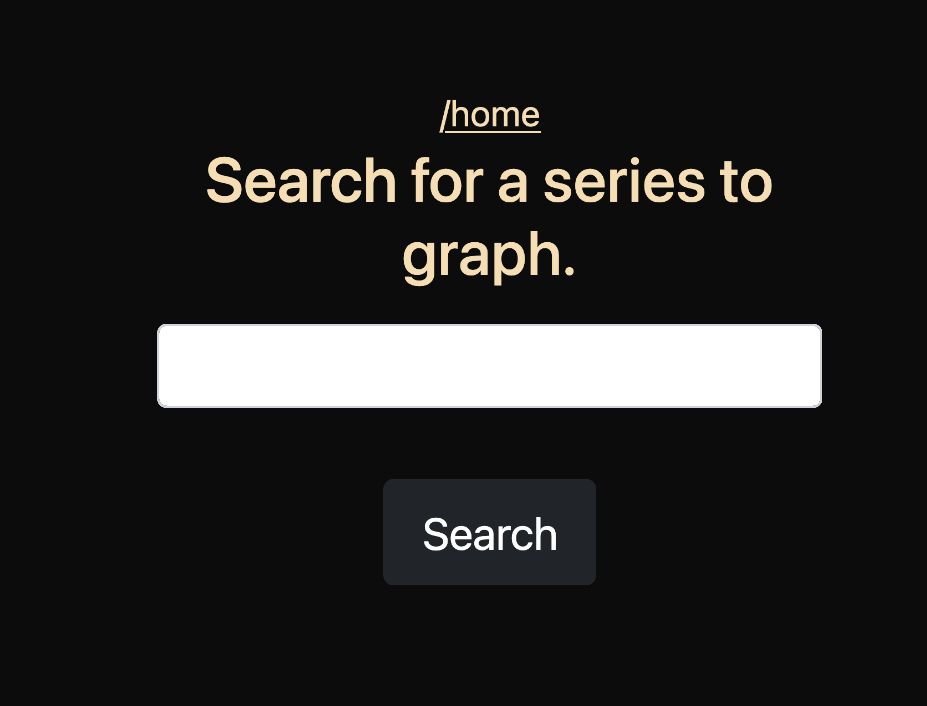
Search for a series to graph and view its ratings over time. The app provides insights into season trends and ratings, allowing users to compare their favorite shows and see how they perform across different seasons.
Discussion highlights
AI-generated summary based on Reddit comments
Users appreciate the unique features of the Series Ratings Chart, particularly the season trends. One user noted, "Game of Thrones is funny, seeing 7 seasons highly rated and then season 8 drops off a cliff."
Another recurring theme in the discussion is the comparison to other rating websites. Another user mentions, "The latter has a clearer interface in some ways," highlighting a desire for improved usability while still valuing the additional data offered.

Comments
You might also like
Labrynth AI
AI regulatory intelligence platform 🌱 Sponsored
Dexa
AI Podcast Assistants for your Favorite Shows
Nestflix
The platform for your favorite nested films and shows.
Indie Thinkers
Discover your next favorite writer.
Library of Short Stories - Authors
Find your favourite author. Read for free, online.
Scorecard.gg
Minimal scoring tool for your favorite board games
Tiii.me
Calculate your total tiii.me spent watching TV shows.
Stencil
The Web's Favorite Online Graphic Design Tool
We Do Data Science
Make graphs in your browser for freeFlickFocus
Explore movies, tv shows and build stats from your ratingsSuper Tiny Icons
Miniscule SVG versions of your favorite logos
My 90's TV
TV from your childhood
Comb.io
The search engine for TV shows.
PodSized: Podcast Summaries
5 Minute AI Summaries of Your Favorite PodcastsColor Arena
Vote on your favorite colors and see a global leaderboard.

Phobio Gadgets to Giftcards
Exchange old devices for gift cards to your favorite stores, incl
UPMASH
Create mashups from your favorite tracks in just one clickObsidian Web Clipper
Highlight and capture web pages in your favorite browser.

Krater.ai
Your AI SuperApp
Flick
Turn your inbox into a finite swipe deck